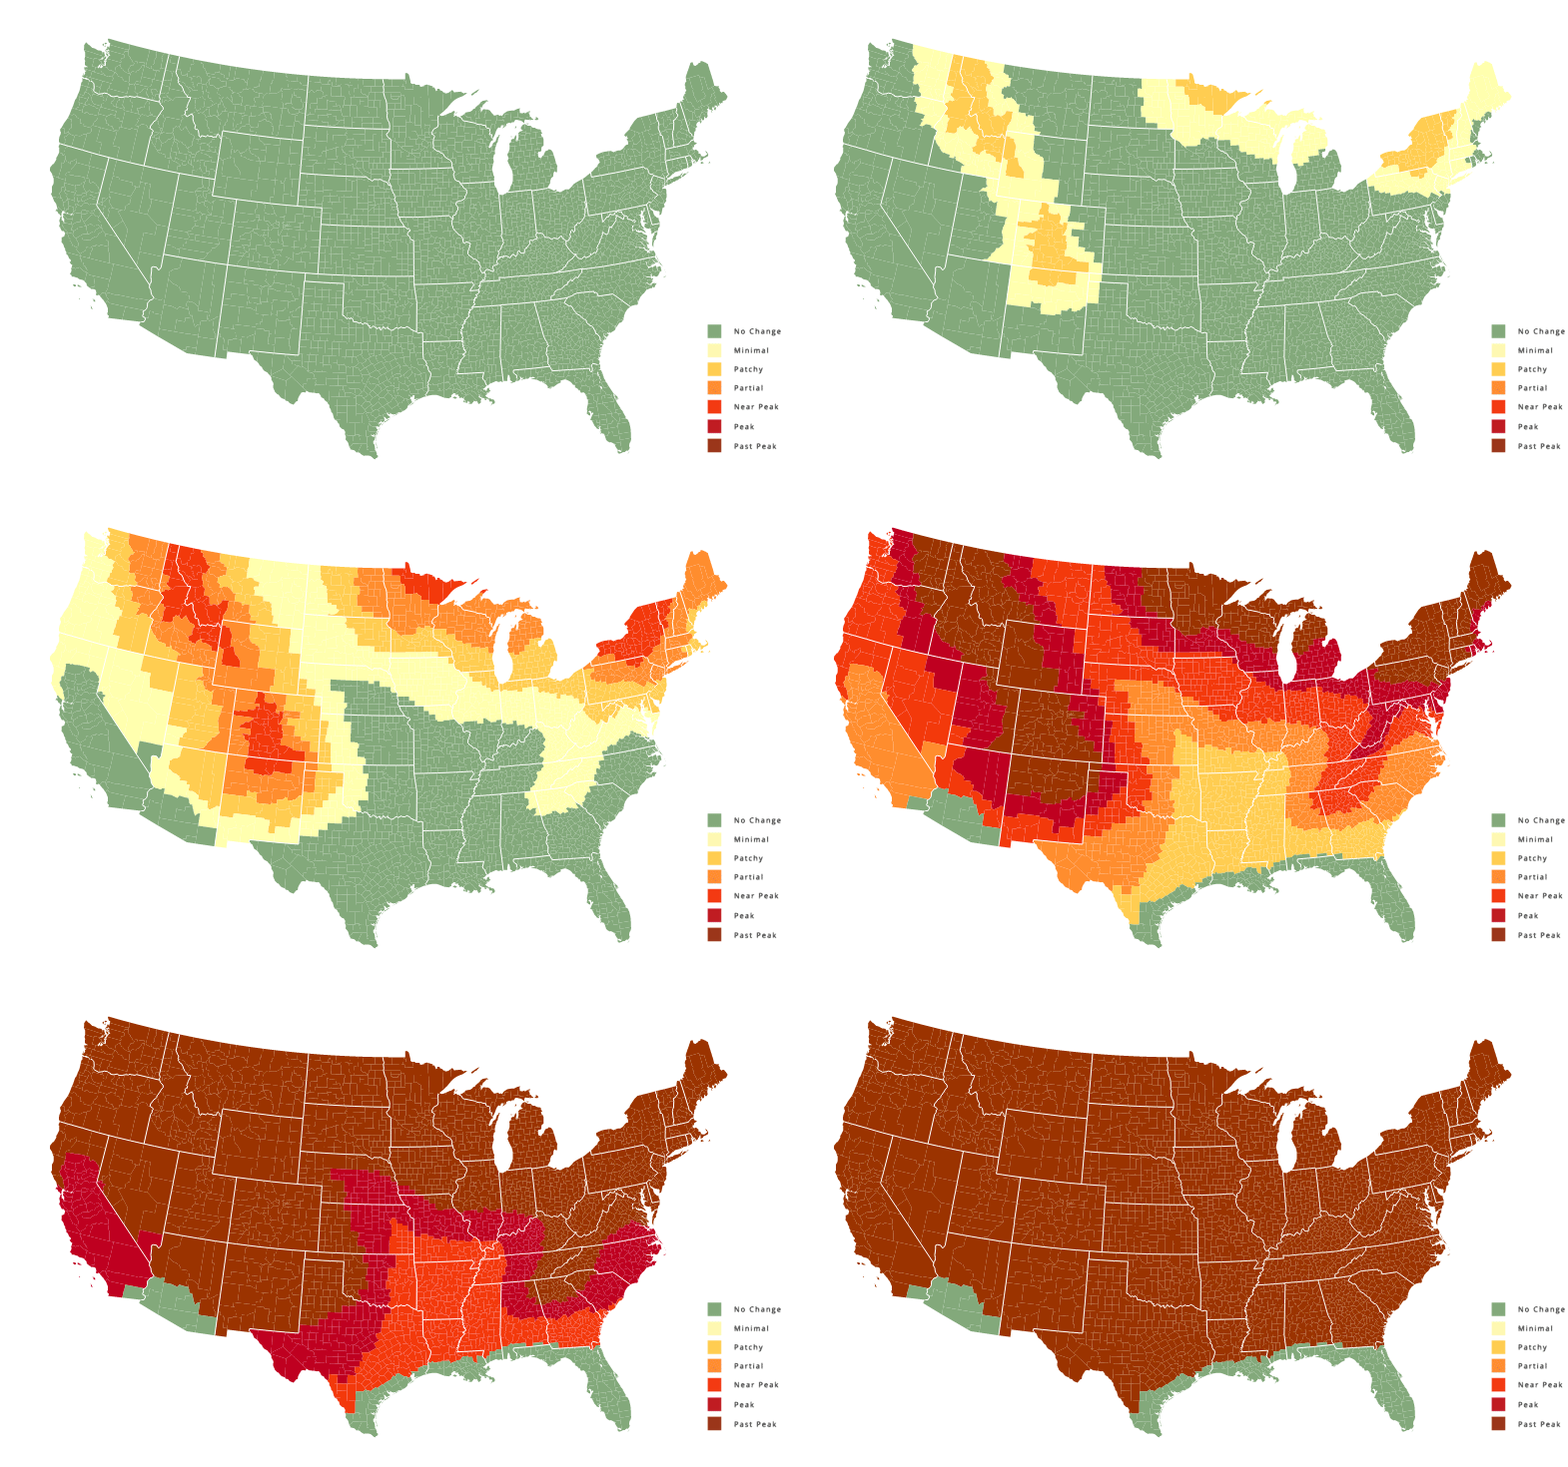
If you’re living in the USA and already can’t wait to capture the changing colors of Autumn, then we’ve got an amazing tool for you! This interactive fall foliage map put together by SmokyMountains.com uses tons of scientific data to predict exactly when, in 2015, each region of the United States will begin to turn yellow, than orange, than red, and finally brown.
This is the second year the map has been created and, with the benefit of another year of experience, co-founder of SmokyMountains.com David Angotti tells us it’s more accurate now than ever.
“The predictive map uses a complex algorithm that computes over 37,000 data points in order to accurately forecast when fall peak will occur at the county-level,” he tells us. Those points include the National Weather Service (NWS) historical temperatures, NWS historical precipitation, NWS forecast temperatures, NWS forecast precipitation, Historical leaf peak trends, Peak observation trends, and many many more.
All of this together helps SmokyMountains.com predict exactly when your county’s leaves will turn:

According to Wes Melton, one of the engineers behind the map, while the science behind why the leaves change color is simple, predicting WHEN they’ll do it is exceedingly difficult.
“A few of the major factors impacting when the leaves will peak include temperature, sunlight, precipitation and soil moisture,” he says. “The Nationwide Predictive Foliage Map is unique—it is one of the only fall maps that offers county-level prediction for the entire continental United States.”
The hope is that the map will, “help fall fanatics everywhere better understand when the fall season will arrive.”
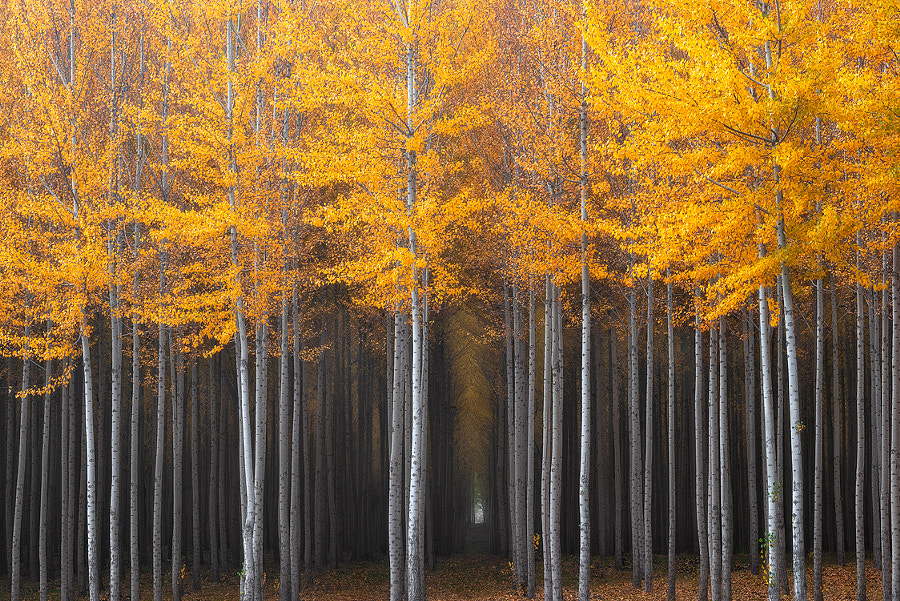
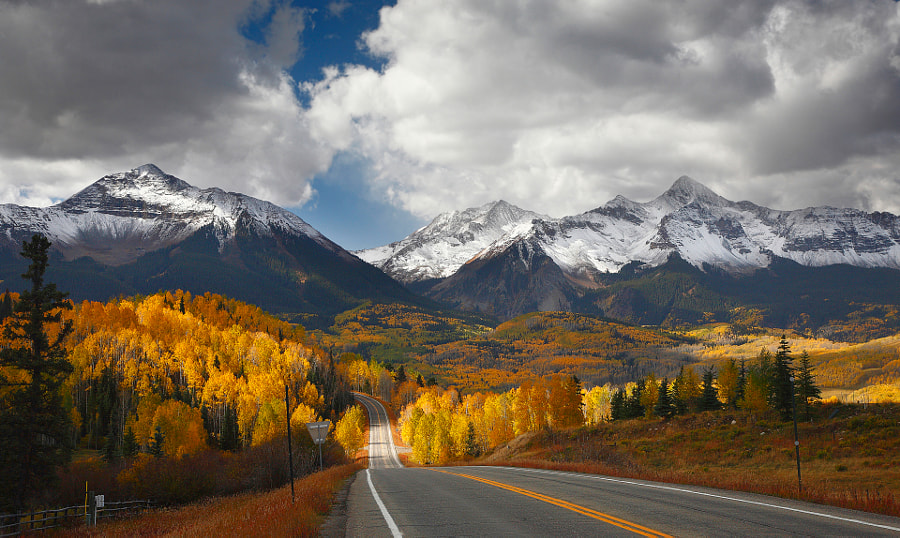
You can check out and play around with the interactive map at this link. Hopefully, with this map as a guide, you’ll be able to plan the perfect fall photography trip and capture images like these:


